Culture across sites
Your brand sounds like the team that answers the phone.
Whether the team is yours or a partner's, customers meet its culture in every conversation. Culture is the language and behaviour people repeat until it feels like the way work is done, so it can be read.
Sariio reads culture from the same place as coaching: how each person prefers to work. Put those preferences together across a team, a campaign or a site, and leaders can see the culture they actually have.
The brand and the floor
Cultural affinity opens the door. Alignment is what customers feel.
38% of organisations that bring outsourced work back in-house cite cultural alignment as a reason. The brand's culture and the culture on the floor both shape every call, and reading both is a practical way to keep them close.
 TL;DR
TL;DR
Whose culture does the customer experience?
When outsourced agents handle your customers, they deliver the outsourcer’s culture; 38% of organisations cite cultural alignment when bringing services back in-house.
Read the exec summaryClose the exec summary
- South Africa’s BPO sector grew 131% from 65,000 workers in 2019 to 150,000 in 2024; UK clients account for 55% of GBS headcount. (BPESA, 2024)
- Deloitte found 38% of organisations cite better cultural alignment as a reason for bringing outsourced services back in-house, while nearly 70% say vendor management lacks maturity. (Deloitte, 2024)
- Impact-sourced employees in South Africa’s GBS sector have 72% lower attrition, and 73% of businesses report hiring more committed and motivated agents through impact sourcing. (Sigma Connected, 2024)
For leaders, assess how your brand’s values show up on the outsourcer’s floor, then agree how agents should handle feedback, escalation and customer decisions.
 TL;DR
TL;DR
Organisational culture is language and behaviour
Culture becomes measurable when leaders read the repeated language and behaviour of their people; culture-strong firms grew revenue 682% over eleven years.
Read the exec summaryClose the exec summary
- Culture is expressed through observable language and behaviour: Schein’s artefacts, espoused values and underlying assumptions all show up in what people say and do (Schein, 2016).
- Across 200+ companies, firms with performance-enhancing cultures recorded 682% revenue growth against 166%, and 756% v 1% net income growth over eleven years (Kotter & Heskett, 1992).
- The Competing Values Framework names four types, clan, adhocracy, market and hierarchy; the article argues a culture is better read as a distribution than a single label (Cameron & Quinn, 2011).
For leaders, notice the words people use and the behaviours they repeat, then map variation across teams before planning change.
For brands that outsource →
Reading the culture
Mirror, map and compass.
The twelve minutes each person spends on their work preferences can be read three ways. For one person it's a mirror. For a team it's a map. For an organisation it's a compass, showing where the culture helps the work and where it pulls against it.
Compare teams and sites.
See where campaigns and sites share a way of working and where they differ, before a change or a new client arrives.
Prepare for change.
Some teams will want the detail early, others the purpose and room to explore. Plan the support each one needs.
Talk about it in plain words.
A heat map and a written narrative give leaders a shared language for what the culture is and what they want it to be.
 TL;DR
TL;DR
Mirror, map and compass
One set of preference readings can reveal individual working styles, team fit and organisational culture, while Gallup reports just 1 in 5 people engaged at work worldwide.
Read the exec summaryClose the exec summary
- Mirror, Map and Compass read one shared set of preference responses at individual, team and organisational scale; Schneider’s attraction-selection-attrition model explains how people shape the place over time (Schneider, 1987).
- A meta-analysis of 172 studies found that fit with the job, group and organisation each predicted satisfaction, commitment and intention to stay (Kristof-Brown et al., 2005).
- The Compass can show readiness across Kotter’s 8 accelerators, assigning each a temperature on a 5-point scale from Frozen to Red Hot (Sariio MAPS, 2026; Kotter, 2014).
For leaders, use preference patterns to shape team conversations and check change readiness before choosing where to focus first.
 TL;DR
TL;DR
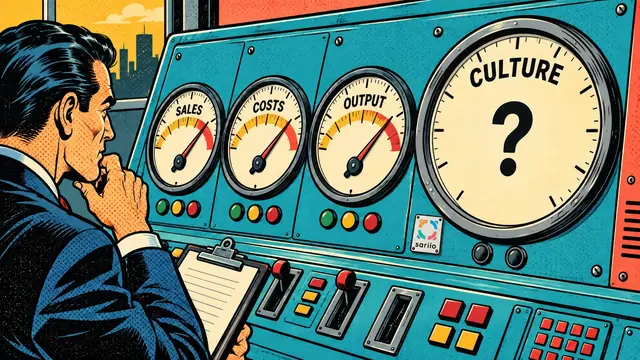
If culture matters this much, why do we measure it so rarely?
92 per cent of 1,348 executives say culture raises firm value, yet culture remains rarely measured because leaders lack a practical way to see it.
Read the exec summaryClose the exec summary
- In a study of 1,348 executives, 92 per cent said improving culture increases firm value, while 84 per cent said their culture needs improving (Graham et al., 2022).
- Toxic culture was 10.4 times more powerful than compensation in predicting attrition, based on 34 million profiles and 1.4 million reviews (Sull and Sull, 2022).
- Sariio’s cultureMAP uses anonymised work-preference responses, gathered in about 12 minutes, to show where preferences cluster or divide (Sariio, 2026).
For leaders, pair retention and performance data with a regular view of work preferences to spot cultural divisions before deciding where to focus.
A facilitated starting point
A 30-day Culture Blueprint.
David's Culture Blueprint reads how your people prefer to work across sites and campaigns, adds change readiness and a values overlay, and ends with a findings conversation with your leadership team.
Start with the change you have in mind, or the client you're preparing for, and the questions your leaders want answered.
Rachel, David's AI assistant, answers 24 hours a day on +44 1904 938867 and books the half hour while you're on the call.
Useful to bring
The change, the people and the question.
What's changing, who it affects and what your leaders need to understand before they decide.
 sariio