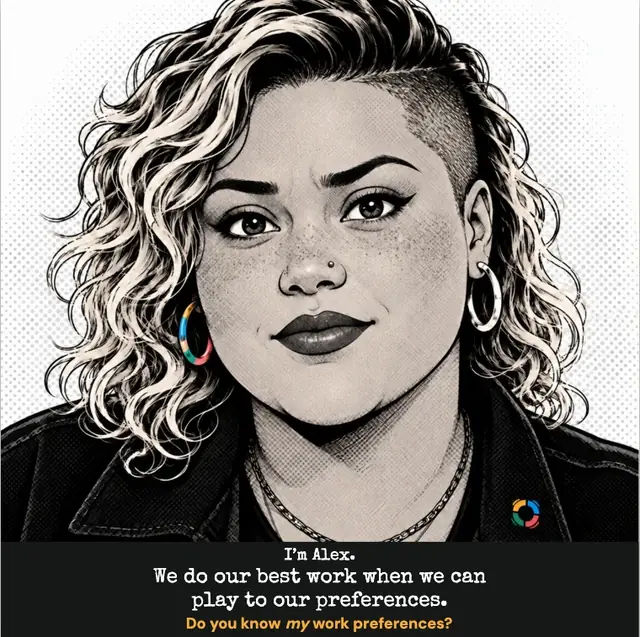
We do our best work when we can play to our preferences.
So do your people. Almost every system in your operation measures what they do. Very little captures how each of them works best, and that's what decides whether coaching lands, whether new starters stay and how your brand sounds on the next call.
Sariio is the work preference layer. Sariio maps how each person prefers to work and carries that into the conversations that shape performance: coaching, onboarding, teamwork and change. For BPOs, in-house contact centres and the brands they serve.
“I'm Alex. Do you know my work preferences?” From the cover of the book behind Sariio. Open the book.
Coaching & performance
Coaching that lands.
How does feedback become something each agent can put into practice in their next customer conversation?
Team leaders and QA need time to coach while the experience is still fresh. The feedback also needs to make sense to the person receiving it.
Sariio AI one2one does the preparation within minutes of a request, freeing up time for timely, personalised coaching. Work preference insights help shape how feedback is explained and explored, with a practical action for the agent to try.
Ongoing use is self-service in the secure, access-controlled Sariio app. Support is available on demand, without waiting for David or a remote team to prepare the notes.
TL;DR
The last mile of coaching
Call evidence identifies something worth discussing. Understanding the person helps shape the coaching conversation that follows.
In the worked example, the same call and QA result produce different coaching notes for two people with different work preferences.
What could personalised coaching look like for your agents?
See how Sariio scales personalised coaching across campaigns and campaign leaders, saving preparation time while applying each campaign's standards consistently.
Apply each campaign's compliance, quality and scoring criteria consistently across its agents and leaders. Work preference insights personalise the coaching without changing those criteria.
For voice, messaging and text-based campaigns, inbound or outbound. Start with three to five agents from one campaign. We prepare individual one2one coaching notes using evidence from your customer conversations, scoring criteria and the work preferences of the agents and their coach.
No charge. No obligation to continue. Every comparison starts with a preparation call with David.
Talk through your campaign and what you want to assess with David before any materials are shared. Together, agree the scope and when the notes will be ready.
Working with Sariio
What working with Sariio looks like.
1
Each person maps their preferences.
Agents and team leaders each spend about twelve minutes answering sixty questions about how they prefer to work.
2
Team leaders get a note for each call.
Sariio reads the call alongside the agent's preferences and prepares a short note on how to coach this person. The team leader decides what is said.
3
A fixed fee to start, then monthly.
The first campaign has a fixed scope and fee in a written proposal. After that, no more than £15 a person a month, with no contract.
Every system measures what people do. Few know how they work best.
Playing to our preferences is the first of the twelve beliefs behind Sariio, and the reason the work preference layer exists.
Contact centres already measure a great deal about what agents do: handle time, adherence, quality scores. Much less is written down about how each person works best. How do they like to take in feedback? Do they want the detail first, or the big picture? Do they think out loud, or on their own first? Those answers decide whether a piece of coaching lands.
The research backs the instinct. Across 172 studies, how well a person fits their work correlates .56 with job satisfaction and .46 with their intention to stay (Kristof-Brown, Zimmerman and Johnson).
TL;DR
We do our best work when we can play to our preferences
Matching work to people’s preferences matters: Gallup found top-quartile engagement teams were 23% more profitable and 18% more productive.
Read the exec summaryClose the exec summary
Gallup’s meta-analysis of 112,312 business units found top-quartile engagement teams were 23% more profitable and 18% more productive than bottom-quartile teams. (Gallup, 2020)
Cerasoli’s 2014 meta-analysis of 183 samples, N = 212,468, found intrinsic motivation reliably predicts performance quality. (Cerasoli et al., 2014)
Sariio MAPS reads 60 work-preference pairs on continuous scales and treats each reading as a snapshot, with people expected to retake it at least twice a year. (Sariio, 2026)
For leaders, look for practical ways to align tasks and collaboration with how people prefer to work, then revisit those preferences as roles and circumstances change.
Work preferences describe how people do their best work, and person-job fit correlates .56 with satisfaction and −.46 with intention to quit.
Read the exec summaryClose the exec summary
Work preferences cover how people build relationships, think and plan, make decisions and get things done; everyone has a full set, and no preference is wrong (Foggin, 2026).
Person-job fit correlates .56 with job satisfaction, .47 with organisational commitment and −.46 with intention to quit, but only about .20 with rated performance (Kristof-Brown et al., 2005).
6 in 10 fully-remote employees would look for a new job if remote flexibility were removed (Gallup, Hybrid Work Indicator).
For leaders, ask how people prefer to work alongside how they feel about work, then use those insights to discuss role fit and working arrangements.
Sariio stands for six steps that turn a preference into a better outcome: Self-awareness, Awareness of others, Resources, Intent, Influence and Outcomes.
Choose a letter to see what it means, with its illustration from the book.
S · Self-awareness
We need to recognise our own preferences before we can make a considered choice about them.
If I can recognise how I prefer to prepare, decide, communicate and act, I have information I can use. I can choose to play to a preference, work beyond it or explore an approach that may change what I prefer. I also have a reason to recognise that my way is one way of approaching the work.
Recognising our own preferences gives us a starting point for understanding differences in others.
You may approach the same work differently. A shared language lets us name that difference and ask whether our understanding is right. What I called reluctance may be a wish to prepare; what you called indecision may be an attempt to explore another option. We need each other’s account before settling on an explanation.
Understanding a difference can give us options that judgement had closed off.
Awareness of each other’s preferences can reveal options and choices we had not considered. Those are resources. If you prefer the big picture first, I can begin there. Mirroring and matching how we each prefer to communicate can be the start of rapport. We can adapt towards each other without pretending to be the same. Questioning a judgement or fixed label can also remove a constraint. Time, skills, attention, trust and relationships still matter; awareness helps us recognise what else we have to work with.
Having more options lets us make a more informed choice about what we want to achieve together.
An option needs a purpose. We can ask what matters to each of us, what outcome we want and what we are prepared to adjust. Our intent may become clearer or change through that discussion. Mutuality means that what matters to both people remains part of the decision, including when the eventual balance is uneven.
An agreed intent gives direction to the actions and conversations we can influence.
We can decide what is within our control, what requires another person’s cooperation and where we need help. We then choose how to act, explain, listen and adapt. Your response can change my approach, just as mine can change yours. That is how a shared intention begins to affect the work.
What happens tells us whether our actions served the intent and what we need to reconsider.
We look at the result, the experience of the people involved and the resources it required. We ask what helped, what did not and whether the outcome served what mattered to both of us. That gives us information to take back into self-awareness and awareness of others. We enter the next decision knowing more, rather than treating the first description or plan as final.
One layer, four conversations that matter to the board.
The same understanding of how each person works best shows up wherever performance, people and your brand meet.
01 Coaching
Coaching that lands.
You already coach. Sariio prepares each conversation around how the agent prefers to work, from the call and your standard, so it changes the next call.
In logistics the last mile is the shortest leg of the journey and the one that decides whether the parcel arrives. Coaching has a last mile too: the moment a team leader turns what the scorecard says into words this agent will hear. Keep your recording, speech analytics, AI and scorecards. They tell you what happened and whether the standard was met. Sariio delivers the last mile, adding the one thing they can't see: the person on the call.
app.sariio.ai · one2one
Practice campaign · Trip refund callAlex · coached by her team leader · 15 Oct
1:50“I can add a refund to your account, which you will be able to receive on your next trip.”
2:15“Just to summarise, I offered you a discount on your next trip. Is that correct?”
Those are different things, and the customer confirmed the inaccurate version. The criterion asks for a summary that matches what was actually agreed.
3The last mile: how Alex hears itfrom her myMAP
Finisher
Frame the summary check as the final quality step that completes the call properly. Leaving a loose thread at close-out will matter to Alex.
Perfectionist
Name the exact mismatch between what was offered and what was summarised. Alex's own bar for getting it right will do the work.
Specific
Quote the two transcript lines directly, so Alex sees the precise gap rather than a general impression of it.
Avoid: rushing the miss or bundling it with other feedback. Alex needs time to examine the specific detail before committing.
4The five-minute one2one
Open with1 minute
Call structure You moved through every stage in the right order, introduction through to close, without losing your place once. The structure held across the whole call.
Closing You closed with the customer's first name. That small detail lands well, and QA awarded full marks.
Look at together2 minutes
At 1:50 you told the customer the resolution was a refund to their account. At 2:15 your closing summary described it as a discount on their next trip. Those are different things, and the customer confirmed the inaccurate version. Put as a close-out gap, not a conduct issue: what one check before the summary would catch that kind of slip?
One thing to try1 minute
You lean towards Finisher, so closing things out properly matters to you. Before you deliver the summary on your next call, say the resolution back to yourself in one sentence and check it matches what you offered earlier in the call. That single check is the close-out the summary needs.
Agree to adopt30 seconds
Does that feel like a step you can run on the next call? Next time, watch the closing summary (this call: FAIL), so the next one2one can show the change.
5The team leader decides
For your team leader: the call showed a solid structure and a warm close, with a factual mismatch between the resolution offered and the closing summary as the key gap. On the next call, Alex is pausing before the summary to confirm the resolution wording matches what was agreed earlier.
Endorse and sendEdit the noteOne line on how the conversation went
What Sariio prepares
For a call worth discussing, Sariio prepares a short note for the team leader: what went well, the moment worth revisiting, one action for the next call and a way to open the conversation with this particular agent. The campaign standard stays the same for everyone. What changes is how it's coached, and the team leader edits the note and decides what's said before anything reaches the agent. See the whole one2one ↗
A real practice call, read against the campaign's own QA sheet. Alex's name is changed; nothing else is. Sariio works from the transcript or scorecard you already keep.
An example
Alex, on a call.
Alex could be anyone on your floor. Her work preferences are real; her name is changed.
On a sample call, Alex handled the customer well and missed a step the campaign scorecard asks for. Sariio prepares a note with that moment, what she did well and one action for her next call.
Her team leader reviews and edits the note before Alex sees it. They talk about the call, agree the action and look at what happens next time.
Alex likes to work a problem through on her own first. So the note suggests sharing the call moment ahead of the conversation, then opening by asking what she noticed. The standard is the same for everyone. The way it's coached is hers.
Coaching is the lever most operations already hold.
It's already in the diary and already in the budget. It needs no extra headcount and no new system. What decides its value is whether it lands with the person hearing it.
70%
of the variation in team engagement comes down to the manager. Gallup
16%
said their last conversation with their manager was extremely meaningful. Gallup
80%
of employees who had meaningful feedback in the past week were fully engaged. Gallup
TL;DR
The return on coaching: better work, one conversation at a time
A 2023 meta-analysis found a medium-sized positive effect from workplace coaching, making clear goals and follow-up essential to seeing what changes in the work.
Read the exec summaryClose the exec summary
A 2016 review of 17 studies found positive effects of workplace coaching on learning and performance outcomes (Jones, Woods and Guillaume, 2016).
A 2023 meta-analysis found a medium-sized positive effect overall, including improvements in skills, attitudes and motivation. Positive findings appeared in manager ratings and participants’ own assessments (Cannon-Bowers et al., 2023).
Coaching success can include wellbeing and engagement alongside financial considerations. Agree a relevant starting measure before sessions begin (Grant, 2012).
For leaders, agree one observable work goal and a starting measure before coaching, then review work outcomes and the person’s experience together.
The feedback sandwich was built to ease managers’ discomfort, yet evidence links praise-led feedback to weaker results; over 38 per cent of feedback effects were negative.
Read the exec summaryClose the exec summary
Kluger and DeNisi analysed 607 effect sizes across 23,663 observations; over 38 per cent of feedback effects were negative (Kluger and DeNisi, 1996).
Feedback helps when attention stays on the task, while praise can pull it towards the self and weaken its effects (Kluger and DeNisi, 1996).
In tests, corrective-first sequences worked best and praise-first least; a separate study found sandwich feedback helped students prepare more thoroughly for a later task (Henley and DiGennaro Reed, 2015; Prochazka et al., 2020).
For leaders, keep feedback specific to the work, put the key correction first, and give praise separately so it feels sincere.
Most early leavers make up their minds inside ninety days.
COPC's benchmarking puts around 70% of a contact centre's first-year attrition inside the first ninety days. That's often before anyone has had the chance to learn how the new starter works best.
TL;DR
Why call centre agents really quit
Around 70% of first-year leavers go within ninety days, so accurate recruitment, tailored onboarding and team leader support are where retention is won.
Read the exec summaryClose the exec summary
Global contact-centre attrition averaged 39 per cent in 2024, reaching 41 per cent in EMEA (NICE, 2025).
Around 70 per cent of first-year leavers leave within the first ninety days, concentrating retention efforts in early onboarding (COPC Inc.).
Replacing one average-performing agent costs around $20,800, making early exits a substantial operating expense (SQM Group, 2023).
For leaders, check attrition by tenure and team leader, then focus on accurate role previews, tailored onboarding and manager support during the first ninety days.
One in four frontline hires say the job was misdescribed, while 12% of US centres lose more than a quarter of new agents within 90 days.
Read the exec summaryClose the exec summary
COPC found 25% of frontline staff did not agree the recruiter accurately described the role; accurately briefed hires reported twice the satisfaction and twice the likelihood of staying. (COPC)
ContactBabel's 2024 US data shows 45% of centres lose 5% or fewer of new agents in their first three months, while 12% lose more than a quarter within 90 days. (ContactBabel, 2024)
Agents typically need six months or more to reach average-agent performance, while replacing one agent costs $10,000 to $20,000. (SQM Group, 2022; McKinsey & Company, 2018)
For leaders, describe the role honestly before day one, then use graded call complexity and close coaching to support agents until competence catches up.
Your clients and your board are asking what AI will change. The evidence so far is good news for people. In March 2025, 95% of service leaders told Gartner they planned to keep their human agents, and the contacts that reach a person are becoming the more complex, more human ones.
Sariio points AI at the people. Sariio does the preparation, so the team leader has more time for the conversation.
TL;DR
The AI paradox: making work human-centric
95% of service leaders are keeping their human agents, and the bigger opportunity is AI that prepares the coaching so managers can do the human part.
Read the exec summaryClose the exec summary
Gartner found 95 per cent of customer service leaders planned to keep human agents, while only 20 per cent reported AI-driven staffing reductions. (Gartner, 2025)
Across 20,000 consumers in 14 countries, nearly one in five said AI support brought them no benefit, four times the failure rate of other AI uses. (Forbes, 2025, reporting Qualtrics)
A field study of 5,172 support agents found AI assistance raised issues resolved per hour by 13.8 per cent, with agent turnover falling by 8.6 points. (Quarterly Journal of Economics, 2025)
For leaders, use AI to prepare individual coaching, then keep the manager in charge of the conversation, especially during agents’ first ninety days.
AI can take the routine contacts, and when it assists agents, productivity rose 13.8% across 5,172 agents and around 35% for the newest.
Read the exec summaryClose the exec summary
In a 5,172-agent field study, AI suggestions raised issues resolved per hour by 13.8%; newer and lower-skilled agents improved around 35%, and turnover fell by 8.6 percentage points. (Brynjolfsson, Li & Raymond, QJE 2025)
Gartner found 64% of customers would prefer companies did not use AI for customer service, and 53% would consider switching to a competitor over it. (Gartner, 2024)
Gartner predicts agentic AI will resolve 80% of common customer service issues by 2029; its 2026 research found 85% of service leaders expanding human agent responsibilities. (Gartner, 2025 and 2026)
For leaders, plan automation around routine contacts and prepare people for the complex, judgement-heavy work that remains.
More than half of entry-level BPO tasks are automatable, yet AI assistance lifted novice agents’ productivity by around 35%, exposing both threat and opportunity.
Read the exec summaryClose the exec summary
Entry-level roles make up 68% of Africa’s BPO and ITES workforce, and more than half of entry-level tasks are automatable (Caribou & Genesis Analytics / Mastercard Foundation, 2025).
Cape Town added a record 11,496 BPO jobs in 2025/26, while the sector targets 500,000 jobs by 2030 (CapeBPO / Outsource Accelerator, 2026).
In a study of 5,172 agents, AI assistance lifted new and lower-skilled agents’ productivity by around 35% and cut turnover by 8.6 percentage points (Brynjolfsson, Li & Raymond, QJE, 2025).
For leaders, redesign entry-level roles around judgement and empathy, and put AI beside new hires to build capability as routine tasks are automated.
Your brand sounds like the team that answers the phone.
Whether that team is yours or a partner's, customers meet its culture in every conversation. The same work preference layer that helps one coaching conversation can show a leader how a team, a site or a whole partnership prefers to work.
For each person, a mirror.
Words for how they work best, and the choice of when to play to their preferences and when the work asks them to adapt.
For two people, common ground.
Where their preferences meet and where they differ, so they can choose how to prepare, talk and work together.
For a team leader, the range.
The spread of preferences across the team, ready for huddles, coaching, planning and change.
For a leadership team, the culture.
How people across campaigns and sites approach relationships, decisions and delivery, so leaders can decide what to keep and what to change.
TL;DR
Whose culture does the customer experience?
When outsourced agents handle your customers, they deliver the outsourcer’s culture; 38% of organisations cite cultural alignment when bringing services back in-house.
Read the exec summaryClose the exec summary
South Africa’s BPO sector grew 131% from 65,000 workers in 2019 to 150,000 in 2024; UK clients account for 55% of GBS headcount. (BPESA, 2024)
Deloitte found 38% of organisations cite better cultural alignment as a reason for bringing outsourced services back in-house, while nearly 70% say vendor management lacks maturity. (Deloitte, 2024)
Impact-sourced employees in South Africa’s GBS sector have 72% lower attrition, and 73% of businesses report hiring more committed and motivated agents through impact sourcing. (Sigma Connected, 2024)
For leaders, assess how your brand’s values show up on the outsourcer’s floor, then agree how agents should handle feedback, escalation and customer decisions.
David Foggin studied organisational leadership at Harvard Business School, with John Kotter as tutor and mentor.
His culture and integration work includes Nestlé UK, Mars Confectionery, the Deutsche Bank and Bankers Trust integration and the executive team at LV=. In contact centres he has worked on operations for Sitel, Inkfish, Everflow and Shadow Global. He built the first version of the work preference map in 2007, and 12,000 people across 40 organisations have used it since.
“Sariio strengthens our ability to have meaningful, data-led conversations with employer partners about candidate fit, while empowering our Shadows with greater insight into their strengths and potential.”
Nate Jacobs, Chief Operating Officer, Shadow Global
“For us to be sustainable, it's this kind of continuous improvement that would really support us. Sariio is an incredible tool.”
Tholakele Nyongo, Head of Facilitation & Training, Shadow Global
What earlier clients reported
Sariio’s first generation, Saviio MAPs, was used by Sitel, Sage, Nigel Frank International, SAM Headhunting and others between 2007 and 2012. Each started by mapping the people already doing the role well.
41 of 42outsourced technical advisers stayed to the end of a nine-month contract
27%above first-month target for new outbound sales agents
10%+lower annual attrition across five Sitel client campaigns
35%+fewer placement drop-outs at Nigel Frank International
 sariio