 sariio
Why culture can be mapped: the six dimensions behind a cultureMAP
- Culture is behaviour, and behaviour is measurable - Kotter and Heskett tied it to economic performance across 200+ companies.
- Engagement surveys measure downstream sentiment; two organisations can post the same score for opposite reasons.
- A cultureMAP adds no new surveys: it aggregates the same twelve-minute reading, anonymised, every person one unnamed point.
- The meaning sits in the distribution's shape - centre of gravity, spread and camps - not in an average.
Every leader has used the phrase, and most could not say where it came from. "The way we do things around here" was coined by Marvin Bower of McKinsey in 1966 and became the working definition of organisational culture when Terrence Deal and Allan Kennedy built their 1982 book around it. It has survived four decades of academic refinement because it captures something the refinements confirm: culture is not the values poster in reception. It is what people actually do, and say, and repeat, at every level of the organisation, until the doing and saying become the norm that newcomers absorb without being told.
The academic literature deepens the phrase rather than replacing it. Edgar Schein, the most cited scholar in the field, describes culture as a dynamic phenomenon, constantly enacted and created by our interactions with others, guided by shared assumptions that operate largely beneath awareness. Ravasi and Schultz characterise it as the set of shared assumptions that guide behaviours, the pattern of collective behaviour taught to new members as the way to perceive, think and feel. Different vocabularies, same anatomy: culture lives in behaviour and language, repeated until it defines the place.
And it matters commercially. John Kotter and James Heskett's Harvard research across more than two hundred companies established that culture powerfully influences economic performance, for better or worse, and that the cultures which fail over time are the ones that turn inward and stop seeing themselves clearly. Daniel Denison's work across thousands of organisations links measurable cultural traits to sales growth, return on equity, customer satisfaction and employee satisfaction. The cost of getting it wrong now has a headline number: Gallup's 2026 State of the Global Workplace puts employee engagement at its lowest point since 2020 and estimates the lost productivity at ten trillion dollars a year, roughly nine per cent of global GDP.
So culture is real, consequential, and defined by behaviour. Which raises the obvious question: if it matters this much, why do most organisations still describe it rather than measure it?
Can organisational culture be measured?
Yes - because culture is behaviour, and behaviour is measurable. Kotter and Heskett's Harvard research across more than two hundred companies tied culture to economic performance, and Denison's work links measurable cultural traits to sales growth, return on equity and satisfaction. The practical route is to measure what shapes the behaviour: the distribution of work preferences across the people in the organisation, which shows up in every meeting and handover, thousands of times a day.
The measurement gap
Why don't engagement surveys measure culture?
Engagement surveys measure sentiment, and sentiment is downstream: the score tells you the temperature of the water without the currents producing it. Two organisations can post the same engagement number for opposite reasons, and a leadership team looking at the score alone cannot tell which organisation it is running. Values statements sit further away still - they describe the culture leadership would like, which is a legitimate ambition and a poor measurement.
The standard instrument is the engagement survey, and it measures something worth measuring: how people feel about working here. But sentiment is downstream. An engagement score tells you the temperature of the water without telling you anything about the currents producing it. Two organisations can post the same engagement number for opposite reasons, and a leadership team looking at the score alone cannot tell which organisation it is running.
Values statements sit even further from the ground. They describe the culture leadership would like to have, which is a legitimate ambition and a poor measurement. Culture audits and consultant interviews get closer to behaviour, but they sample a sliver of the organisation through a subjective lens, and they age from the day the report is bound.
What none of these instruments reach is the layer the research keeps pointing at. If culture is behaviour and language repeated until it becomes the norm, then the question that matters is: what shapes the behaviour? And here the answer is well established, even if it is rarely operationalised. Behaviour at work is shaped by the individual's motivations and preferences meeting the norms of the group. How a person prefers to build working relationships, how they prefer to think and plan, how they prefer to reach decisions, and how they prefer to turn decisions into finished work: these preferences show up in every interaction, every meeting, every handover, thousands of times a day. Multiply them across everyone you employ and you are looking at the raw material culture is made from.
That is the layer Sariio samples.
How a cultureMAP is derived
What is a cultureMAP?
A cultureMAP is an organisation's culture read from the actual preference data of its people. Each person who has taken the twelve-minute survey appears as a single anonymous point; the points assemble into six dimensional fields built from the four factors of Relationships, Thinking and Planning, Making Decisions, and Getting Things Done. Nothing is collected fresh and nobody answers a special culture questionnaire: the map aggregates the same readings that power each person's own report.
Sariio's foundation is a twelve-minute survey of sixty paired statements, grounded in the metaprogramme tradition of Neuro-Linguistic Programming: the study of the habitual patterns by which people filter, sort and act on information. Rather than assigning people to types, the survey places each person on a set of preference pairs, sliding scales between two equally legitimate orientations. Wary or trusting in relationships. Concern for the task or concern for the people. Independent or interdependent. Problem-solving or risk-taking. Procedures or options. Specifics or the big picture. Starting or finishing. Perfecting or pragmatic. None of these poles is a strength or a weakness; each is a place where people genuinely work well, and the point of the instrument is orientation, never evaluation.
Those preference pairs roll up into four factors, and the four factors describe the whole cycle of work. Relationships: how a person prefers to connect with the people work is done with. Thinking and Planning: how they prefer to approach problems, risk and structure before acting. Making Decisions: how they prefer to move from consideration to commitment. Getting Things Done: how they prefer to carry commitment through to completion. Relating, planning, deciding, doing. Every job contains all four, whatever the industry and whatever the seniority.
An individual's positions across the four factors produce their own map, in plain language they recognise. A cultureMAP is what happens when an organisation's worth of those individual positions are assembled into one picture. Nothing is collected fresh; nobody answers a special culture questionnaire. The map is built from the same preference data that powers every person's own report, aggregated and anonymised, with each person appearing as a single unnamed point. That distinction matters more than it first appears. A culture questionnaire collects opinions about the culture, one more layer of sentiment. A cultureMAP assembles the culture's source material: the actual distribution of the preferences that shape how its people behave.
The six dimensions, and why these six
What are the six dimensions of a cultureMAP?
Direction, Action, Approach, Impact, Commitment and Process - the complete set of pairings of the four preference factors, not a curated shortlist. Direction pairs Relationships with Thinking and Planning; Action pairs Making Decisions with Getting Things Done; Approach joins planning to deciding; Impact joins relating to delivering; Commitment crosses relationships with decisions; Process runs from plan to completed work. Because the six are every pairing, nothing about how the organisation relates, plans, decides and delivers falls between them.
A cultureMAP reads the organisation through six dimensions, and the six are not a curated shortlist. They are the complete set: every possible pairing of the four factors. Four factors combine in exactly six ways, and each pairing illuminates a different junction in how work actually happens.
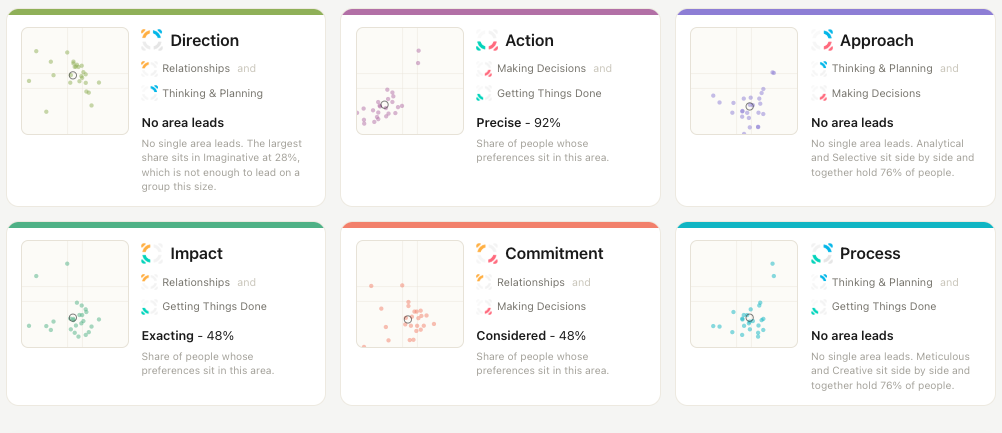
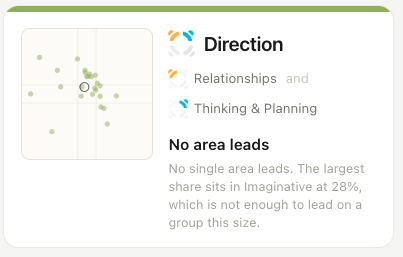
Direction pairs Relationships with Thinking and Planning. It is the blueprint layer: how people prefer to combine their approach to others with their approach to problems before anything is done. An organisation's Direction map shows whether ideas tend to be opened socially or worked privately, whether planning is structured or exploratory, and how much variety exists beneath the surface.
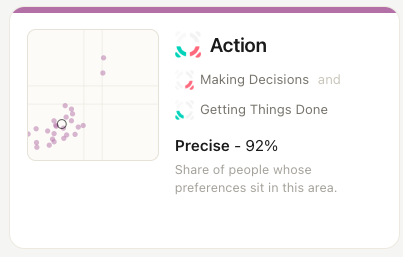
Action pairs Making Decisions with Getting Things Done. It is Direction's practical counterpart: how choices are actually made and carried into finished work. Here the map shows whether the organisation's centre of gravity favours deliberation or commitment, perfection or pragmatism, starting energy or finishing discipline.
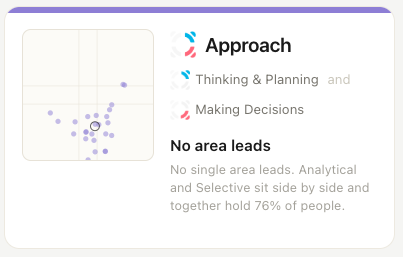
Approach pairs Thinking and Planning with Making Decisions: the junction where analysis becomes commitment. An Approach map reveals how an organisation prefers to move from thought to choice, whether it charts the route before departing or tests its way forward, and whether that preference is shared or splits into camps.
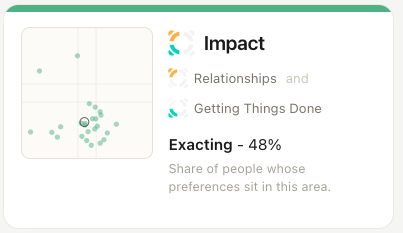
Impact pairs Relationships with Getting Things Done: the junction where working with people becomes delivering with people. It shows how the organisation prefers to turn collaboration into results, and whether delivery is anchored in shared standards, personal drive, or the energy of the group.
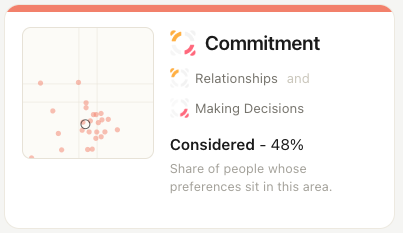
Commitment pairs Relationships with Making Decisions, crossing the map diagonally. It is the junction where social dynamics meet commitment: how decisions travel through the organisation, whether people prefer to be consulted before choices land, and how trust and caution shape who commits to what.
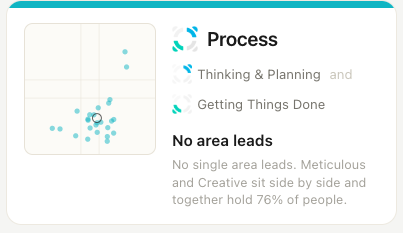
Process pairs Thinking and Planning with Getting Things Done, the other diagonal: the full journey from plan to completed work. It shows whether the organisation's planning style and finishing style pull in the same direction, and whether work is finished fast, finished carefully, or finished differently in different corners.
Because the six dimensions are every pairing of the four factors, nothing about how the organisation relates, plans, decides and delivers falls between the instruments. And the geometry gives one further gift: the six dimensions form three opposing pairs, and each opposition asks a question leaders recognise instantly. Direction faces Action: do we act on our direction? Approach faces Impact: does our approach create impact? Commitment faces Process: does our commitment match our process? These tensions are not bolted on; they fall out of the structure, which is a reasonable sign the structure is carving the subject at its joints.
What the map actually shows
Each dimension renders as a field. Every person who has completed the survey appears as one anonymous point, positioned by their actual answers, never rounded into a category first. That principle, raw positions rather than buckets, is what keeps the cultural story intact, because the story lives in the shape of the distribution.
Three properties of that shape carry most of the meaning. The centre of gravity: where the collective mass of preference actually sits, which is the organisation's default answer to that dimension's question. The spread: whether people gather tightly around the centre, meaning the preference is widely shared and will feel like the way we do things to almost everyone, or scatter loosely, meaning individual experience varies and no single norm dominates. And the camps: the cases where the distribution splits into two distinct populations, each large enough to sustain its own norms. A two-camp dimension is often the most valuable finding on the whole map, because it explains friction that no average could reveal: the change programme that half the organisation experiences as sensible caution and the other half as obstruction, the planning process that one camp finds reassuring and the other finds suffocating.
Each map also carries a written narrative in plain language, generated from the computed distribution and a locked pattern library, so the reading is grounded in the evidence and does not change between viewings. The narrative includes the element most instruments avoid, and the one Kotter and Heskett's failed-culture research argues matters most: what this culture may find harder to see about itself. A tightly clustered culture is a strong culture, and strong cultures buy their coherence with blind spots. Naming the likely blind spot is not a criticism; it is the part of the mirror that earns its keep.
Taken together: the holistic view
Any one dimension is informative. The six together are something more, because culture is not six separate phenomena; it is one phenomenon viewed through six complete cross-sections.
Read together, the maps compress into a signature: one dominant region per dimension, six words that describe the organisation's default way of working, each word backed by evidence about how much of the organisation actually shares it, and shown plainly as a split wherever a dimension divides into camps. Read comparatively, the maps scale: the whole organisation, a department, a team, each gets its own map from the same data, so leadership can see where a division's culture pulls against the whole, and where the shape of a team that consistently delivers holds lessons worth understanding. And read over time, the maps stay alive: preferences shift with context and circumstance, people can re-survey as their situations change, and the picture leadership works from describes the organisation as it is now rather than as it was when the consultants visited.
This is also where culture stops being a separate conversation from the rest of people strategy. Because the cultureMAP is assembled from the same data as every individual report, every pairing comparison and every team map, the levels illuminate each other. The preferences that explain one person's working style are the same preferences that, in aggregate, explain the organisation's culture. Hiring, onboarding, team formation and culture cease to be different instruments answering different questions and become one body of evidence answering all of them.
What a cultureMAP will not do
It will not score your culture, rank it against other companies, or tell you what to change. That restraint is deliberate. Preferences are orientations, not capabilities; a culture map has no good or bad regions, only accurate ones. The research is detailed: cultures succeed when they fit their strategy and adapt as circumstances change, which means the same cultural shape can be an asset in one market and a liability in another, and only the people leading the organisation can judge which. What has been missing is not judgement. Leaders have never lacked opinions about their culture. What has been missing is evidence: a current, measured, shared picture of the thing itself.
"The way we do things around here" has been a definition for sixty years. It can now be a map. And once it is a map, the questions that follow are better ones: not what is our culture like, but what does the evidence show, where do we divide, what can we not see, and what do we want to do about it. People do better work when they can play to their preferences. An organisation does better work when it can finally see what those preferences are.
Sources
- Bower, M. (1966), The Will to Manage, McGraw-Hill - "the way we do things around here" origin. Excerpt republished by McKinsey, 2003
- Deal, T.E. and Kennedy, A.A. (1982), Corporate Cultures: The Rites and Rituals of Corporate Life, Addison-Wesley. See also Wikipedia: Organizational culture
- Schein, E.H. (2017), Organizational Culture and Leadership, 5th edn, John Wiley & Sons - culture as "a dynamic phenomenon"
- Ravasi, D. and Schultz, M. (2006), 'Responding to Organizational Identity Threats', Academy of Management Journal, 49(3), pp. 433–458
- Kotter, J.P. and Heskett, J.L. (1992), Corporate Culture and Performance, Free Press - 200+ company study linking culture to economic performance
- Denison, D.R. (1990), Corporate Culture and Organizational Effectiveness, John Wiley & Sons. See also Denison Consulting
- Gallup, State of the Global Workplace 2026 - engagement at lowest point since 2020; $10 trillion lost productivity estimate
- NLP metaprogrammes: see Wikipedia and Charvet, S.R. (1997), Words That Change Minds, Kendall/Hunt